
Looking ahead at the rest of the week we could get an idea of which count is in play by the size of the bullish falling wedge that develops. If the bullish count that intermediate wave (4) is tracing out an abc correction, then we should see a bottom around 1707, the S2 support on the daily chart below.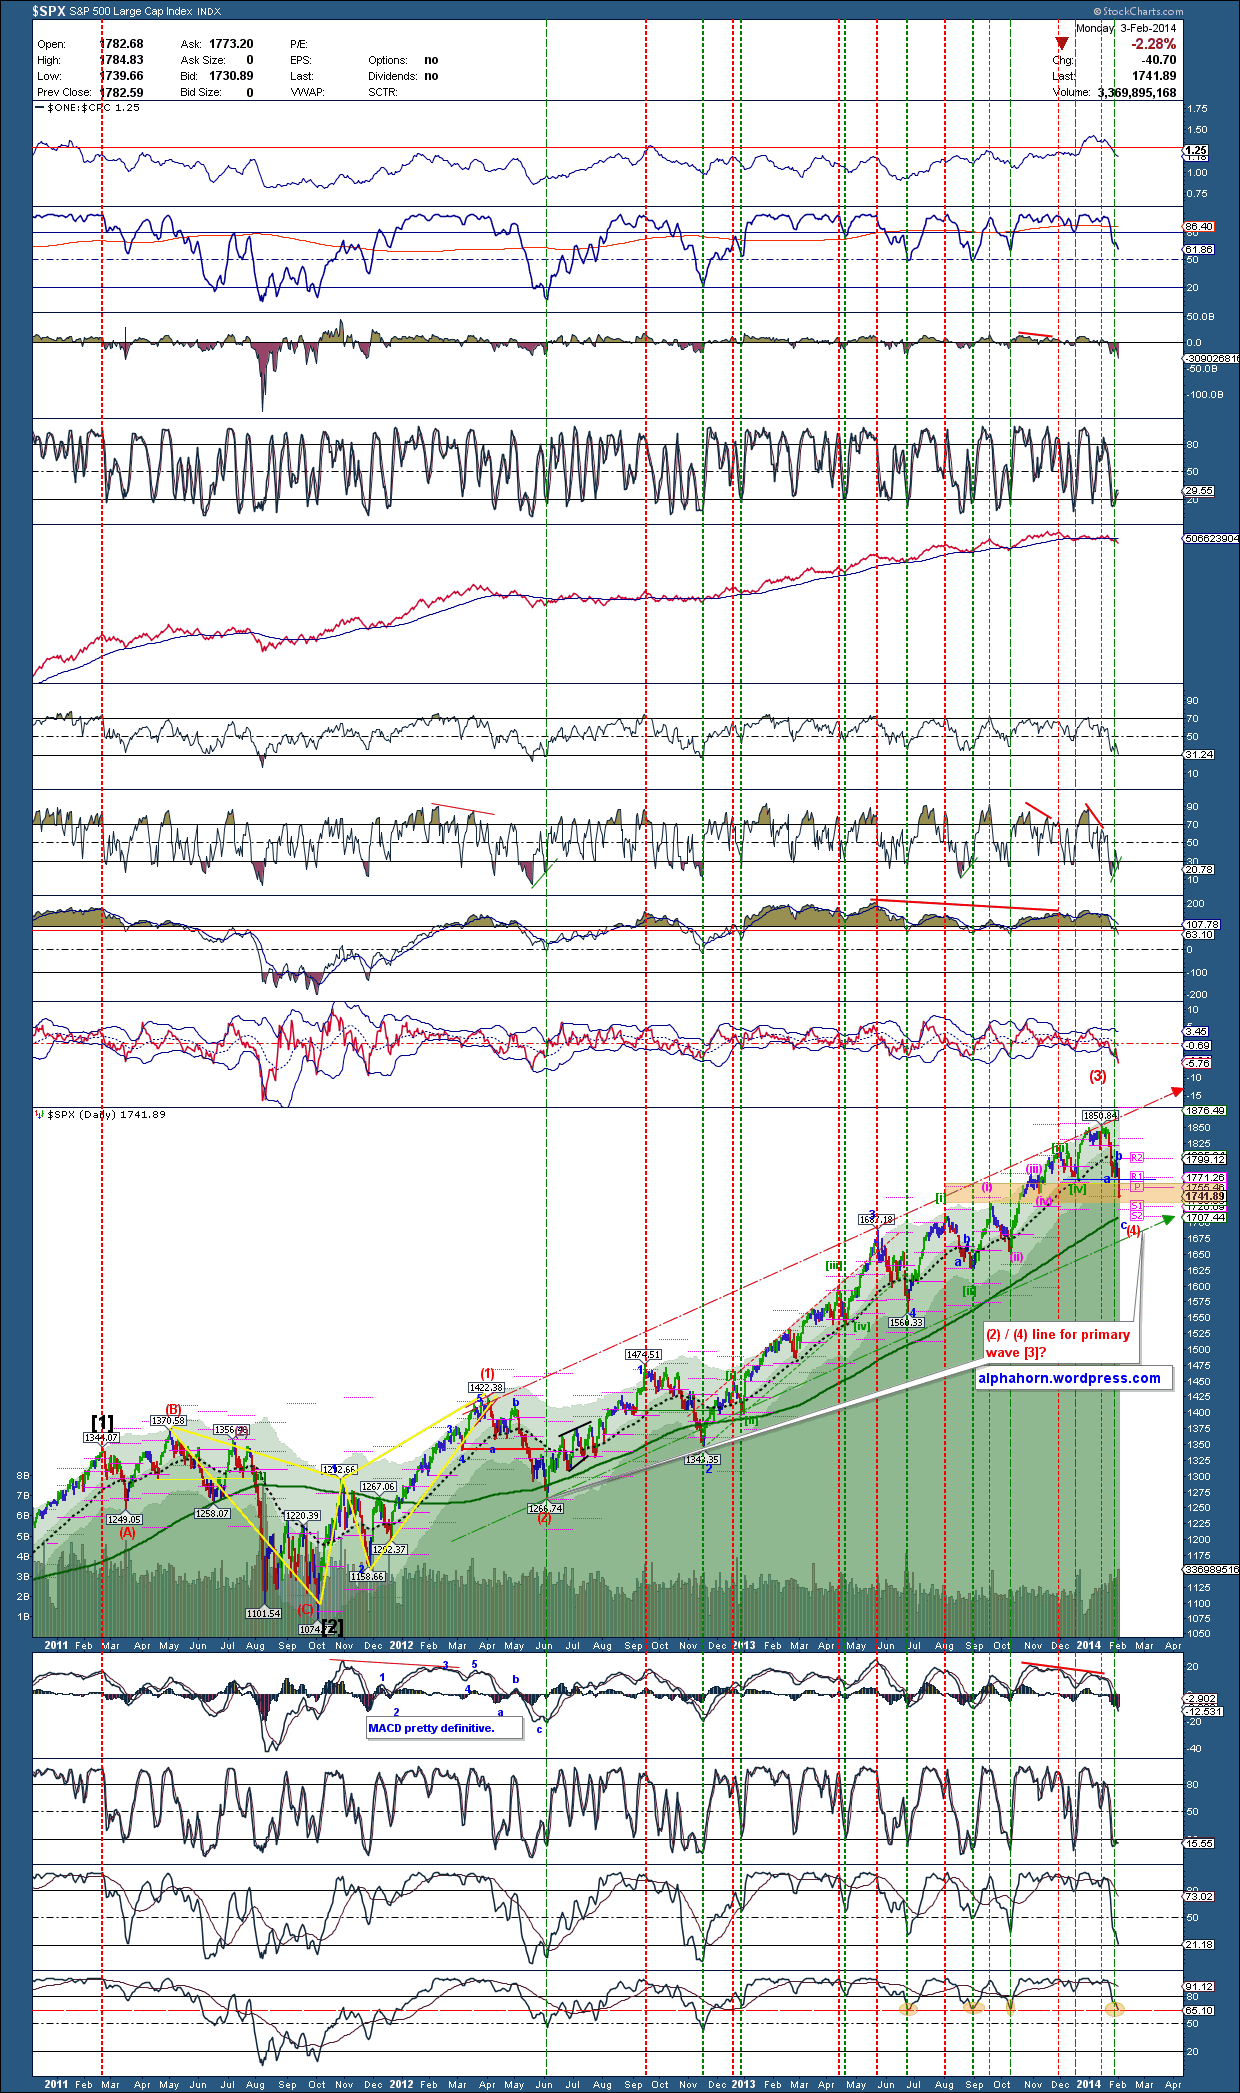 The 30 min chart shows the smaller proposed wedge, the upper line will be set by the expected small bounce today and perhaps into tomorrow. The timing might work to go short at today’s close, then long for either the beginning of wave (5) of [3] or the wave (B) correction under the bearish count, either at Friday’s close or Monday’s close.
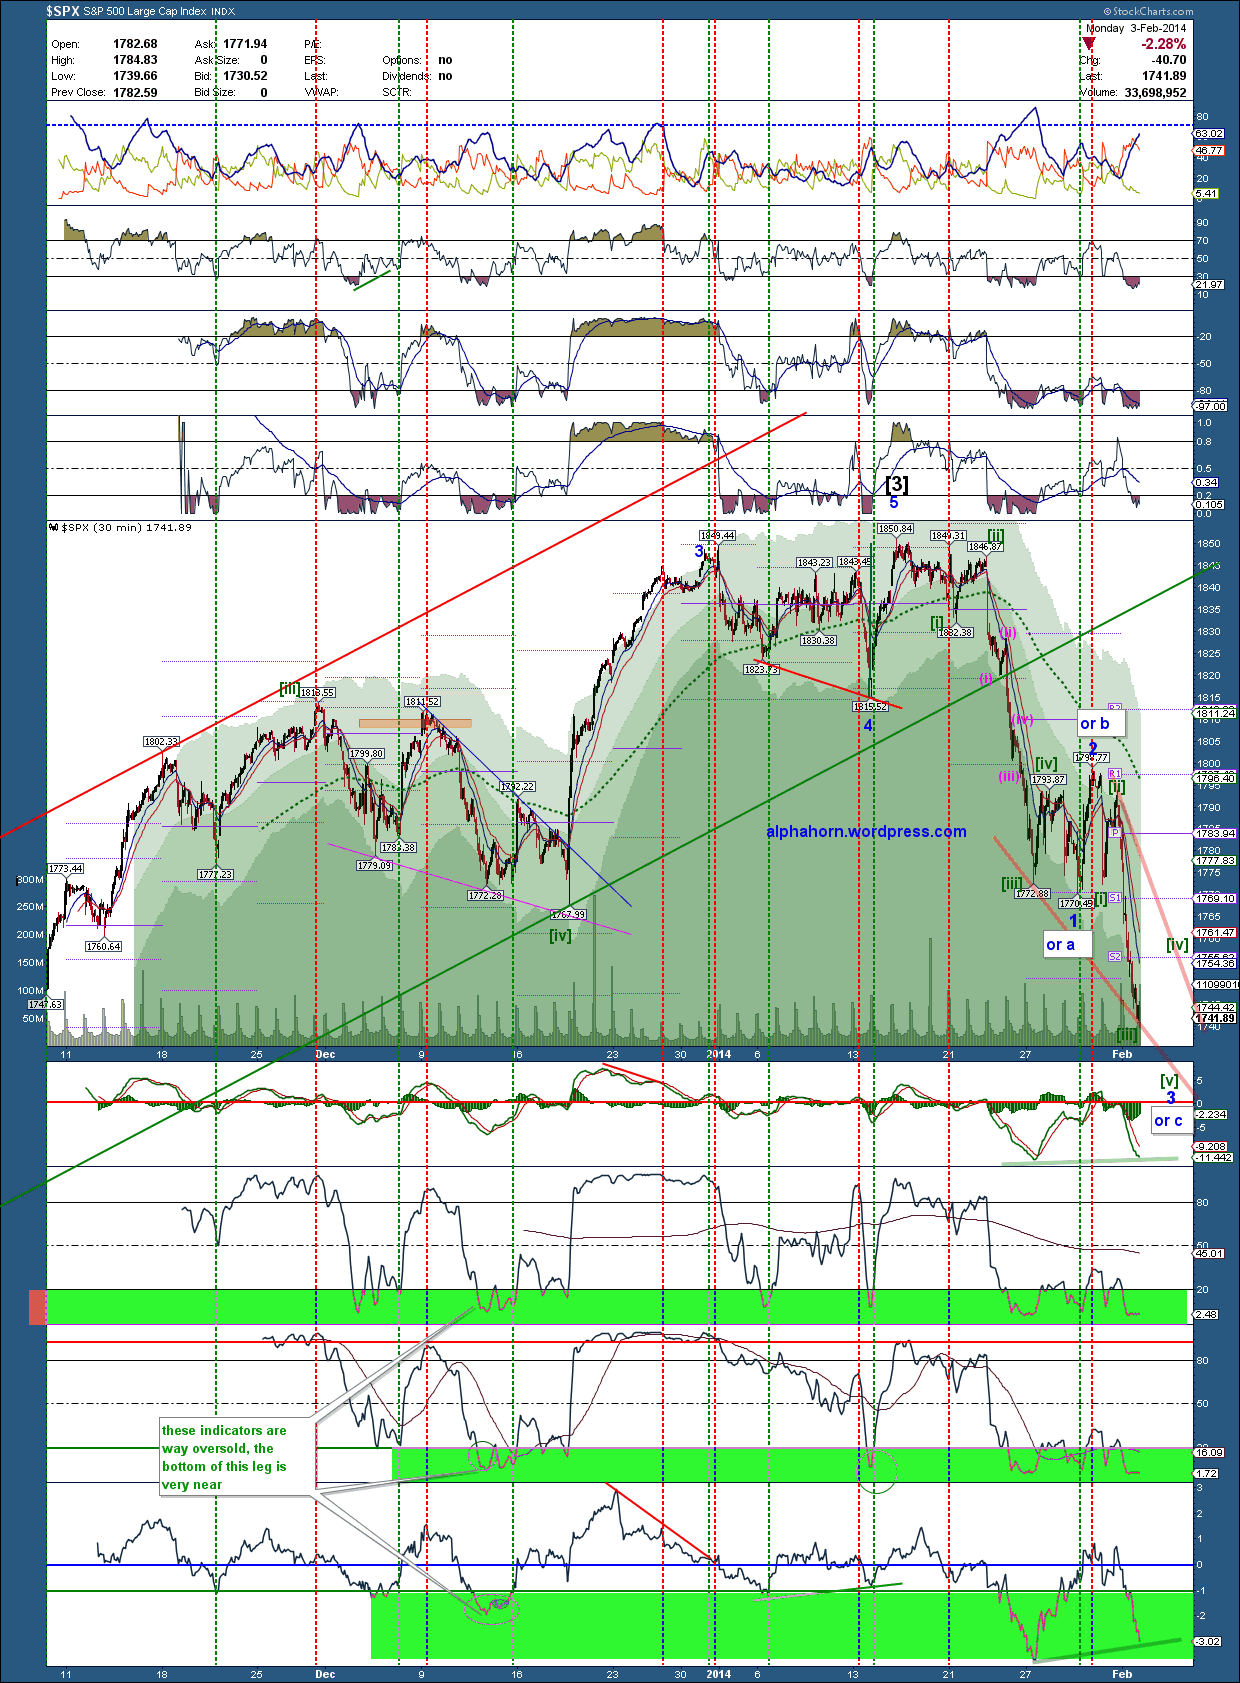
YTD Performance 2024: +40% as of 7/17/25
2024 +79%
2023 +57%
2022 -46%
2021 +36%
2020 +40%
2019 +27%
2018 +6%
2017 +16.3%
2016 +32%
2015 +3.6%
2014 +.02%;
2013 +61.78%;
2012 +31%;
2011 +77%
Follow me on Twitter
My TweetsEmail Notifications
Join 215 other subscribers-
Recent Posts
Archives
- July 2026
- June 2026
- May 2026
- April 2026
- March 2026
- February 2026
- January 2026
- December 2025
- November 2025
- October 2025
- September 2025
- August 2025
- July 2025
- June 2025
- May 2025
- April 2025
- March 2025
- February 2025
- January 2025
- December 2024
- November 2024
- October 2024
- September 2024
- August 2024
- July 2024
- June 2024
- May 2024
- April 2024
- March 2024
- February 2024
- January 2024
- December 2023
- November 2023
- October 2023
- September 2023
- August 2023
- July 2023
- June 2023
- May 2023
- April 2023
- March 2023
- February 2023
- January 2023
- December 2022
- November 2022
- October 2022
- September 2022
- August 2022
- July 2022
- June 2022
- May 2022
- April 2022
- March 2022
- February 2022
- January 2022
- December 2021
- November 2021
- October 2021
- September 2021
- August 2021
- July 2021
- June 2021
- May 2021
- April 2021
- March 2021
- February 2021
- January 2021
- December 2020
- November 2020
- October 2020
- September 2020
- August 2020
- July 2020
- June 2020
- May 2020
- April 2020
- March 2020
- February 2020
- January 2020
- December 2019
- November 2019
- October 2019
- September 2019
- August 2019
- July 2019
- June 2019
- May 2019
- April 2019
- March 2019
- February 2019
- January 2019
- December 2018
- November 2018
- October 2018
- September 2018
- August 2018
- July 2018
- June 2018
- May 2018
- April 2018
- March 2018
- February 2018
- January 2018
- December 2017
- November 2017
- October 2017
- September 2017
- August 2017
- July 2017
- June 2017
- May 2017
- April 2017
- March 2017
- February 2017
- January 2017
- December 2016
- November 2016
- October 2016
- September 2016
- August 2016
- July 2016
- June 2016
- May 2016
- April 2016
- March 2016
- February 2016
- January 2016
- December 2015
- November 2015
- October 2015
- September 2015
- August 2015
- July 2015
- June 2015
- May 2015
- April 2015
- March 2015
- February 2015
- January 2015
- December 2014
- November 2014
- October 2014
- September 2014
- August 2014
- July 2014
- June 2014
- May 2014
- April 2014
- March 2014
- February 2014
- January 2014
- December 2013
- November 2013
- October 2013
- September 2013
- August 2013
- July 2013
- June 2013
- May 2013
- April 2013
- March 2013
- February 2013
- January 2013
- December 2012
- November 2012
- October 2012
- September 2012
- August 2012
- July 2012
- June 2012
- May 2012
- April 2012
- March 2012
- February 2012
- January 2012
- December 2011
- November 2011
- October 2011
- September 2011
- August 2011
- July 2011
- June 2011
- May 2011
- April 2011
- March 2011
- February 2011
- January 2011
- December 2010
Meta
Trading Rules
Iwill be adding to this section over time as questions come up in the comments section.
1) Do not EMAIL me, or INSTANT MESSAGE me or try to communicate with me in any way asking questions about buying or selling stocks, options, ETFs or anything else…I am not here to give investment advice. This is an educational and entertainment blog. I post my trades and why I trade the way I do for those two purposes. Sometimes you will learn from my good trades other times from my bad trades. But, your investment decisions are YOURS!
2)Stops: These are based upon daily closing prices for ETFs and stock, but are real time for OPTIONS. If peg a stop to a moving average for a specific time frame, then it is fluid and is based upon the final candle for that time frame. For example, if the stop is the 50 MA on the 60 minute chart, then the position remains if the closing candle for the day on the 60 min chart is above the 50 MA on that chart, and it closes out if it is below the MA. However, there are times when one shouldn’t wait for the close: a) should an index break down below a key pivot area that I have highlighted, then one need not wait for the close to exit a position, b) if it is evident that an index will close on the wrong side of a stop, then one can exit. Or, should the indexes impulse in the direction opposite the position.
3) The Portfolio at times will trade against the Alphahorn Swing System, based upon either immediate term indicators and/or Elliott wave counts. These positions should be viewed as high risk entries and like all investment decisions, one should consult their investment advisors and/or consider one’s own risk tolerance before considering such positions. Like everything else on this site, these are not recommendations to trade any particular security.
4) Do not ask me what my indicators are. I’ve spent years developing them and they are proprietary.
5) Averaging Down: In a word – DON’T! NEVER EVER AVERAGE DOWN. If you follow the position sizing rule above then this rule should be implied automatically. Once you’ve invested 2% of you capital your have reached the limit and NO MORE CAPITAL IS TO BE COMMITTED TO THAT POSITION!
IMPORTANT NOTICE
The content on this blog (Alphahorn.wordpress.com) is provided as information only and should not be taken as investment advice. All site content, including advertisements, shall not be construed as a recommendation to buy or sell any security or financial instrument, or to participate in any particular trading or investment strategy. The ideas expressed on this site are solely the opinions of the author (Alphahorn) and are for entertainment purposes only. Alphahorn is not a licensed investment advisor or commodity trading adviser nor is he licensed as such with any federal or state regulatory agency. Alphahorn does not manage client assets in any way. Any investment decision that results in losses or gains made based on any information on this site is not the responsibility of Alphahorn. Alphahorn may make statements about certain investment vehicles and strategies, but it is not to be taken as investment advice. I provide an educational service, not an advisory or stock recommendation service. At times, Alphahorn will analyze the technical structure (chart) of various stocks or financial markets, but he is in no way compensated by the companies he analyzes either in reports or daily commentaries. All examples are provided for educational purposes.Tags
- best stock market blog
- bit
- bitcioin
- bitcoin
- bitcoin blog
- bitcoin technical analysis
- bitcoin trader
- blockchain
- BTC
- btcusd
- crypto
- cryptocurrencies
- cryptocurrency
- cryptos
- dow
- dryptos
- elliott wave
- elliott wave analysis
- equities
- equity
- ETH
- ethereum
- ethusd
- finaicial markets
- financial blog
- Gold
- how to trade
- investing
- market
- market analysis
- market crash
- Miners
- MSTR
- naad
- Nasdaq
- nasi
- ndq
- NVDA
- QQQ
- russell
- s&p
- S&P 500
- sotcks
- spx
- stock market
- stock market educational
- stocks
- swing trading
- technical analysis
- Tesla
- top financial blog
- top stock market blog
- TSLA