
We had a wonderful 2013, finishing the year up 61.78%. Many of you have shared our success with friends who have subscribed, I appreciate the endorsement. I don’t advertise and completely rely on word of mouth, so if you’re happy with your subscription and believe others can benefit from what we do here, then please pass along your experience.
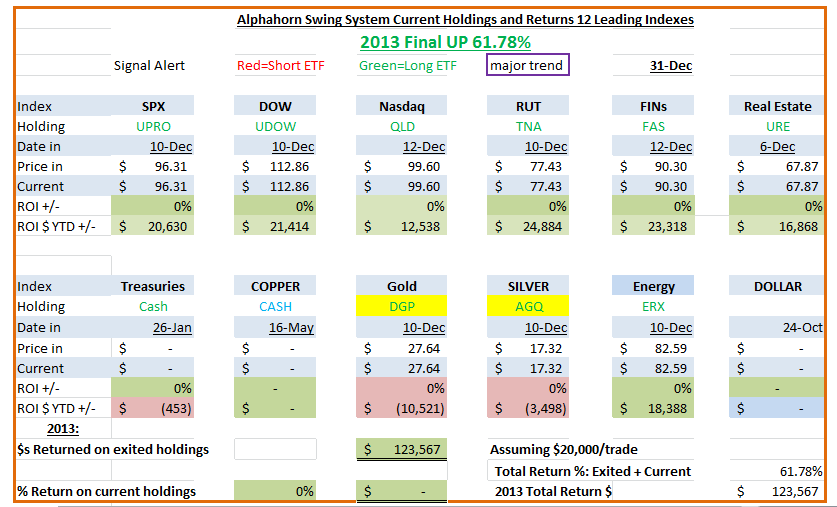 Above is the final summary table for 2013. All trades for 2013 assumed $20,000 of investment capital for each trade. Ten indexes were traded in 2013: SPX, DOW, Nasdaq, Russell, Financials, Real Estate, Treasuries, Gold, Silver, and Energy. Seven of the ten indexes produces positive returns, three lost money. The biggest winner was the Russell returning $24,884, the big loser was Gold losing $10,521. Here’s a look at the these 10 indexes:
- The Russell was top performing sector for 2013. The System took 12 trades, 8 winners and 4 losers that netted: $4759, -$38, -$151, $1,897, $680, $4,331, $6539, $576, -$854, -$1353, $7108, $1390 for a total return of $24,884.
- The Financials were the 2nd best performing sector, also taking 12 trades, 9 winners and 3 losers that netted: $7163, $4716, $1647, $6075, $319, -$955, -$1454, $43, -$702, $3921, $43, $2502 for a total return of $23,318.
- The Dow was the third best performing sector. It took 10 trades ALL WINNERS that returned: $5395, $2643, $1497, $1992, $283, $108, $1340, $5965, $98, $2093 for a total return of $21,414.
- The SPX was the fourth best performing sector. The SPX took 11 trades, 8 winners and 3 losers that returned: $4439, $4429, $1043, $2554, $3059, $390, -$627, -$796, $4835, -$122, $1426 for a total return of $20,630.
- Energy was the only profitable commodity index and was the fifth best performing index. It took 11 trades, 7 were winners and 4 were losers, which returned: $5126, -$596, -$686, -$517, $2614, $2308, $4899, -$748, $3788, $435, $1765 for a total return of $18,388.
- Real Estate finished the year as the sixth best performing index. It was very unique index as it corrected far deeper than the other indexes. It began the year with a nice bullish run and finished with a large sell off. For the year, Real Estate took 10 trades, 9 were winners and only 1 trade lost money. These 10 trades returned: $2594, $1437, $4328, $3075, $3272, $1124, $407, $968, -$367, $30 for a total return of $16,868.
- The seventh and final index to earn a positive return for 2013 was the Nasdaq. The Alphahorn Swing System took 11 trades, 7 winners and 4 losers that returned: -$344, -$586, $948, -$239, $2192, $1397, $3294, $135, $4675, -$314, $1380 for a total return of $12,538.
- The System took only 1 trade for the Treasuries, then dropped that index, that trade lost -$453.
- Silver also was a loser in 2013, its 5 trades returned: -$2128, $918, -$194, -$293, -$1801 for a total loss of -$3,498.
- Finally Gold was the big loser of 2013. A good deal of the blame is on my shoulders as I put my incorrect wave count ahead of the system and tried repeatedly to catch a falling knife. Gold’s 9 trades produced only one positive trade and 8 losers: -$758, $1974, -$4439, -$1287, -$2330, -$1252, -$534, -$57, -$1838 for a total loss of $10,521.
In total, the Alphahorn Swing System took 91 trades in 2013 that netted $123,568 or a 61.78% return on the $200,000 of capital as of 1/1/2013. 2013 will begin with $323,568 of capital and will invest $30,000 per trade.
If you are interested in subscribing to our newsletter, then I invite you to peruse the tabs. Check out the testimonials, what our subscribers are saying about their experiences. Check out the demo tab to see how the system is used. Note, there are other charts that are used too from time to time in an attempt to maximize returns and better time entries. If would like to subscribe, then follow this link to our subscription page: http://alphahorn.blogspot.com/
i am on a trial membership, is there a way to look at the active/current trades on a daily basis, at the end of the day or even during the day. ?
thanks
I am on a active membership and I would like to go to a page and see what trades you are in. I am not sure what we should be in or out.
Thanks,
You should be making your own decisions. I post 2 table EVERY NIGHT. The top one is what my proprietary Alphahorn Swing System says we should be in and if we were how we would be doing. The bottom one is the trading Portfolio which at times has a mind of its own and trades against the Swing System based upon other immediate term indicators I use. some people follow one some the other, some both, that’s your call
Sorry, I am new here, but I am not able to find the two table you are talking about.
Thanks
The 2 tables are in each nightly update. one at the top the other at the bottom of the nightly post